
Date: Saturday, May 30, 2015 (Race)
Location: Big Island, Hawaii
Photos: As noted
OVERALL
5:07:38 total time, which put me at:
16/156(10.3%) Finishers in the Men’s 35-39 AG
83/1466 (5.7%) Finishers Overall
My primary goal going into Ironman 70.3 Hawaii (Honu) this year was to break 5:00 hours, and that was ultimately not in the cards. I can’t really say I am upset, as I put in a 10:00 improvement over my time last year, felt I ran as strong as I could have given the hot conditions and had an absolute blast with Sarah and the TriForce Triathlon Team. I love this race and everything about it: (i) the overall location, (ii) the fabulous course and (iii) the top-notch production Ironman puts on for this race (i.e., the great finisher’s zone and post-race BBQ). It is my favorite race to be honest – so I had a blast! In my actual race, there were some hiccups and definitely a lot of key takeaways to improve on, but all-in-all I executed on my overall race plan and ran fairly well given the heat.
Given I have only been training with Coach Kevin Coady from the TriForce Triathlon Team since December, I feel like I have made vast improvements in my fitness and overall race strategy so far, and I know I will only continue to improve. So the year-to-year numbers don’t really show as much progress as I think I have made so far. Last year was windier on the bike, but much cooler on the run in my opinion (so it is really tough to truly compare). I just need to keep putting in the work and more dramatic results will eventually show. For comparison, here are my times and splits from this race in 2014 and 2015:
2014: Total: 5:17:57, S: 35:38, T1: 4:16, B: 2:46:05, T2: 2:26, R: 1:49:32
2015: Total: 5:07:38, S: 36:09, T1: 4:06, B: 2:45:43, T2: 2:34, R: 1:39:06
Having said all of the above, I really want to get to a sub-5:00 level for the 70.3 distance and come back next year at throw down like <4:50 in Honu!
After the HITS Napa Valley Half Ironman, Coach Coady scheduled a recovery week and then a 5-week half-ironman specific build period, followed by a 1-week taper period culminating in Ironman 70.3 Hawaii. The table below has my total volume of workouts during that 7-week period from 4/13 until 5/31 (with gray indicating uncompleted planned volume, light blue completed planned volume and dark blue “excess” volume). After the first recovery week, my targeted average volume during the 5-week build period until the last taper week was 12:12 hours/week, and I averaged 11:54 hours/week.

Similarly, the table below is my Performance Management Chart during the same 7-week period from 4/13 until 5/31.

I summarized how to interpret this chart in my race report for HITS Napa Valley Half Ironman, but I think it is worth repeating here:
To put this chart in perspective, the blue portion is “fitness”, which is CTL (chronic training load) encompassing the TSS (training stress score) of all workouts older than 15 days prior on a particular day of measurement. The pink line is “fatigue”, which is ATL (acute training load) encompassing the TSS of all workouts within the past 14 days of a particular day of measurement. Finally, the yellow line is “freshness”, which is TSB (training stress balance), encompassing essentially the ratio of CTL to ATL on a particular day. To cut through everything, the goal on any race day is to maximize your “fitness” (CTL) and “freshness” (TSB). Hence, a taper period before the race where your fatigue goes down quickly (ATL), your freshness goes up quickly (TSB) and there is minimal loss on your overall fitness (CTL).
You can see in the chart above my taper week that the fitness (CTL – blue) gradually goes down, but freshness (TSB – yellow) goes up rapidly with the fatigue (ATL – pink) declining rapidly.
Enough with the nerdy science! Sarah and I flew into Hawaii on the Thursday before the race, and headed to the condo we rented at Mauna Lani. We went rented a condo this year in lieu of staying at the Fairmont Orchid (the host hotel) as the hotel was easily walkable from the condo and it was nice to have more space. Having done both options, I think Sarah and I preferred the condo more as we could cook our own meals rather than eating out all 3 meals every day. Our lanai had a wonderful view. Photo: Nick

After some race check-in matters on Friday (i.e., the athlete meeting and dropping off bike and run gear), I was off to bed early Friday night for an early start on Saturday.
SWIM
36:09 swim leg time, which put me coming out of the water at:
41/156 (26.3%) Finishers in the Men’s 35-39 AG
247/1466 (16.8%) Finishers Overall
The swim is at Hapuna Beach State Park, which in my opinion is honestly one of the best beaches on the west side of the Big Island. In fact, later in the week Sarah and I came back here two other days to lounge, as it is a huge white sandy beach with great swimming and facilities. Here is a shot from later in the week. Photo: Nick

After final preparations in T1, I headed down to the water early to get in a short warm-up. I swam over a Honu turtle during the warm-up, which was awesome! Photo: Sarah

This year, there were bigger waves coming into the beach as the announcer had indicated a very large South Swell was coming in the following day. Based on seeing the increased size in waves the next day (shown in my pictures later in this Race Report), I am sure glad it didn’t come in on race day! The only impact to the actual swim was that the out-going currents coming in back to the beach seemed much stronger than last year. Across the board, everyone on TriForce that did the race last year seemed to have swim times 2-3 minutes slower this year. Photos: Sarah


This year, they also broke up with swim groups into a wave start – which I generally dislike compared to a mass swim start as the wave starts tend to lead to a congested bike if you are in a later wave. Fortunately, I was in the first wave of Men’s AGs 18-39! Coming out of the water, running up the hill to T1. Photo: Sarah

What Worked
Warm-Up – I was able to get down well before the start and get in a good warm-up. It felt good to make sure my swim skin was fitting correctly and loosen up my shoulders.
Sighting – I swam a pretty good course as far as sighting the buoys and getting off feet if I felt they were going the wrong way. Even into the sun at the last buoy, the goggles I brought for this race were tinted very well and I could make out the swim exit arch (which is generally difficult given the rising sun is directly in your face).
What May Have Worked
Drafting – I was pretty successful in locking onto feet about 80% of the swim. I had such success with this in Hits Napa that it became my number one goal into this swim. Accordingly, most of the swim felt very “relaxed” to me. I say this may have worked as I think I drafted off the wrong feet and swam way too slow. Although it seems swim times were generally slower than last year on this swim, I think 36:09 is much too slow for me right now at the half ironman distance. It is a minute slower than last year and my swim fitness is much stronger.
What Didn’t Work
Pacing – I need to get better at open-water pacing, in particular when drafting. It is just such a difficult and “fine art” to balance swim power and effort. Meaning, I find the sliding scale of “perceived effort” hard in the swim as I tend to either (i) feel smooth and fine (i.e., under swim) or (ii) be totally gassed (i.e., over swim). I need to figure out that in-between stage.
T1
4:06
Sarah graciously ran up from the beach to catch me in T1 putting on my bike helmet and gear before heading off! Photo: Sarah

What Worked
Race Plan Dialed – I had gone through my T1 plan mentally a bunch, and nailed it. I largely walked/slow jogged up the long ramp and hill from the beach to the parking lot to get my HR down and took off the top of my swim skin during the walk. At T1, I threw it and cap/goggles in our race bag (they transport them to the finish for you), threw on the shoes and helmet and lastly put on the LG M2 Suit. Felt efficient. A long transition time generally as it is a long run from the beach and then out to the bike exit.
Potential Area for Improvement
Flying Mount? – I didn’t put this as “What Didn’t Work” as I had intentionally put on my shoes at my transition station and ran to in them to the mount line and jumped on the bike (as there is a hill immediately out of T1 on the bike). This largely worked fine. I note this as a potential area for improvement in that I need to learn how to do a flying mount where my shoes are already on the pedals and attached to the frame with breakable rubber bands, so that I can run in transition in bare feet, which is much faster than running in bike shoes with SpeedPlay cleats. I can already do a flying dismount at the bike to run transition, but I haven’t practiced the mount yet. I was probably wise to not try that new concept here with the hill.
BIKE
2:45:43 bike split time, which put me coming off the bike at:
41/156 (26.3%) Finishers in the Men’s 35-39 AG
199/1466 (13.6%) Finishers Overall
I ended up riding Normalized Power of 209w during the bike leg, and I have put a link to my TrainingPeaks bike leg race file HERE. Note, I stopped my Garmin a touch short of my actual full time pulling into T2). My time was only about 25 seconds faster than last year, which I largely attribute to a very conservative bike this year.
The Honu bike course is essentially the middle half of the full Ironman World Championship bike course, including the climb and descent to Hawi. This year, there were very little winds during the ride, which was a pleasant surprise as the cross winds (particularly descending from Hawi) can be brutal in Hawaii. It was definitely a year to push the bike pace, which unfortunately I did not do. However, the lack of winds also came into plan later in the run, which was scorching hot without the winds blowing away some of the stagnant hot air in the lava fields and providing a cooling effect.
My Garmin elevation profile of the bike course and a map of the ride are below.


What Worked
Nutrition – Per my race plan, I took in 293 calories per hour with sips from my concentrated nutrition bottle every 15 minutes. I also stuck my bottle in the freezer when I woke up on race morning so it stayed cold for largely the entire ride.
Hydration/Heat Management – I was also very good about drinking a ton. I filled up my xLab Torpedo BTA bottle at least 3X on the bike (together with starting with it full) – that gave me well north of my plan of 24oz/hour with electrolytes. I also would grab a spare water bottle at each aid station and dump it over my back, neck, face and in the hole in my helmet to cool off. I think this helped out – as I could tell on the bike without the wind that it was very hot out and would be scorching on the run.
Power Caps – I was pretty good and sticking to my power caps on all of the climbing on the bike. For instance, I ran my Normalized Power on the climb to Hawi in Training Peaks, and it was only 226W. That was my goal “average” for flats, so I definitely hit the hills extremely conservatively.
Coasting at High Speeds – Similarly, I was pretty good about coasting at high speeds (i.e. soft-pedaling when above 25mph and coasting completely when above 30mph). Basically, I think I coasted about 90% of the descent from Hawi, and would only pedal shortly to get back up above 30mph. Without any winds, it was very easy to get aero and tuck.
What Didn’t Work
Under Bike? – This is always a tough debate, as I was super focused on holding back for the run. However, when looking at my power analysis in TrainingPeaks, I was super conservative. Here is what I had for my Race Plan:
o For flats/normal speeds, around 225w (80% FTP), cap at 230w (82% FTP).
o For moderate hills (speeds around 12-13ish mph), cap at 245w (88% FTP).
o For steep hills (speeds below 12mph), do my best to stay low power and cap at 280w (100% FTP)
o For 25-30mph on descents, back off power and stay aero. Above 30mph, coast and stay aero – except for descent from Hawi.
However, I was way under for everything. My Normalized Power for the entire race was only 209w, which is obviously a bit low because of the coasting (i.e., my Average Power for the descent from Hawi was 74W and Normalized Power was 131W (just from a couple of pedaling spots to speed back up)). Where I possibly under biked was the hills. As noted above, I was very good at staying below my power caps, but I basically targeted my flats/normal speeds of 225W for everything (including hills). In Training Peaks I used the chart to select sections from every climb, and it seems that I was always around 225W NP on every climb (i.e., only 226W for the entire climb to Hawi). Under bike? Smart move? Tough to tell. Next time I race this, if I am feeling good I am going to push the hills to keep up speed on the uphill, while staying below my power caps. Meaning, for a climb like Hawi I would be with a NP near 260-280w, as opposed to 226w. Obviously a lot depends on conditions, how I am feeling, etc… As you can see, even for a race like this where I feel I biked too conservative, holding my run goal paces was not ultimately possible given the heat.
No Age Group Spots – Appears I didn’t make up any spots within my age group on the bike – at least I stuck at 41/156. Still that is crazy to me that I finished the bike in the same place I finished the swim!
T2
2:34
Largely uneventful – 2:34 was reasonably fast (albeit a touch slower than last year).
What Worked
No Man’s Land in No Pass Zone – Coming up to the turn into Mauna Lani, I went above power for a bit on the last downhill to pass 3 people so I was in front going into the “no pass zone” about a mile out from T2. Once I was in there, there was no one around so that worked out great. Last year, I got stuck behind someone going very slow.
Flying Dismount – Worked well – feet out of shoes and Garmin on wrist as I approached T2 and hopped of the bike while still moving.
Sunscreen – I had packed some spray sunscreen, which was huge to put on. I also then donated it to the other folks in transition next to me, which I think earned me some karma points.
What Didn’t Work
Bike Mount – This year T2 was not numbered and assigned racks, but just first in run to the back in sequemce. That worked fine in my opinion. However, I do wish they reinstated the volunteer handoff for the bike. It may sound selfish, but I found that awesome (where you handed your bike the to volunteers at dismount and they walk and rack your bike). With the new racking structure, I think it would be fine for us to run our bikes to the applicable row, but then maybe we can give them to volunteers standing there to actually rack. In my case, the racer in front of me was having trouble racking so I had to sit there for some time waiting. No big deal, though.
RUN
1:39:06 run split time, which had me finishing at:
16/156 (10.3%) Finishers in the Men’s 35-39 AG
83/1466 (5.7%) Finishers Overall
I ended up running the half marathon at a 7:36/mile average pace, which included walking some hills and aid stations as I described further below. I have put a link to my TrainingPeaks run leg race file HERE. I’m not sure why my Garmin was faster at 0.1 mile shorter.
There is no other way to describe the run this year other than HOT! I think the lack of winds just caused the run to feel so much hotter as you didn’t have the cooling effect from the winds and the hot, stagnant humid air on the golf courses and in the lava fields was just sitting there with no where to go. I was drenched by the end of the race and I don’t think I have ever finished a half ironman distance feeling as depleted as I did coming off this run. Even at HITS Napa Valley Half Ironman earlier in the year where I PRed the run leg on a much hiller run, I was not nearly as “crushed” feeling during the run and at the end as I was in Honu. The conditions in Hawaii are a beast to race, and whether it is strong, soul-crushing winds on the bike, or insane heat on the run, they are not to be underestimated.
The run in Honu is an up-and-down, all-around course that is somewhat difficult to settle into a pace on. It wanders over the Mauna Lani golf courses, including running on twisty cart-paths and fairways. It also travels on roads through the lava fields, which are extremely hot. The “Road to Nowhere” is a particularly notorious stretch late in the race that is a long slight downhill where you can never really see the turnaround, and once you get there it is the long slog back. That stretch is crazy hot!
My Garmin elevation profile of the bike course and a map of the ride are below.


Around Mile 2, the run course actually travelled up a golf course fairway directly outside the front door of our condo, more or less. Sarah was awesome and set up a chair out there under a tree in the shade with a sign and a stereo playing 1980s tunes and cheered everyone on. She was also in a bikini top, which I am sure gave many a male racer a big boost early on!!!! She also got some great shots of some of the TriForce team heading out on the run.
Here is Coach Kevin with a blazing fast 1:31:36 run split despite the hot conditions. Photo: Sarah

Andrew rocking the speedo – definitely wins best kit award during the run. Andrew unfortunately struggled with heat exhaustion and smartly dropped out mid-way through the run as he has had serious issues in the past and has Ironman Coeur d’ Alene coming up in the end of June. Certainly a difficult, but justified decision, as Andrew smoked the swim and the bike legs. Photo: Sarah

Li, who I believe had a team best 1:29:04 run split (that is 6:47/mile average pace). Unreal in these conditions! Photo: Sarah

Yohann, who came off a great 2:34:14 bike split and held it together with a 1:44:35 run. I caught up to Yohann at the beginning of the “Road to Nowhere” and we basically ran with each other for the remainder of the race (until he pulled ahead in the last mile).

I was particularly pumped to see Sarah cheering us along, en route to my 1:39:06 run split. Photo: Sarah

Lastly, Sarah got a picture of Sven as well with a 1:57:11 run split. There were a bunch of other TriForcers racing at Honu that put up some awesome times (more on that below). Photo: Sarah

As I detailed further below, I stuck to my race plan very well for the first half of the race, but ultimately couldn’t hold my pace as I was getting so hot. I ended up walking aid stations so I could dump enough water and ice on myself. There were also a couple of short, steep hills that I walked.
Some shots of me that Caroline got by braving the heat out on the “Road to Nowhere”. Photos: Caroline Bontia


The scariest part was right before the Mile 12 aid station, Yohann and I ran around a corner and there was a race sitting on the middle of the path having a very serious seizure. There were volunteers there who confirmed Medical Support was quickly coming, so we kept running – but that definitely took my legs out the last mile. I really hope that racer ended up OK, as I assume it was heat related. I actually heard through the grapevine that the Medical Tent ran out of IVs after the race due to all of the racers who came in with heat exhaustion this year.
On a more positive note, the last 200 yards is through the lava right next to the beach and it is awesome. Photos: Sarah


What Worked
Nutrition – I filled up my hand bottle with Coke at the first aid station immediately outside of T2 and then drank sips every 5 minutes. My race plan was for 20oz/hour, providing 240 calories/hour. I honestly upped that during the run, and ended up likely drinking 20oz/45minutes. My stomach handled it well, which bodes well for the increased calories I will need for Ironman Boulder.
Passing Age Group Racers – It appears I passed 25 people in my age on the run (and 116 overall). It is always a mental boost to pass people on the run, particularly when I am in a self-inflicted state of melt-down as well!
Vaseline Socks – I thoroughly lined my socks with a ton of Vaseline, as I knew my feet would be completely soaked by the first aid station due to dumping water, ice and sponges on myself. This worked great as I got no blisters, despite the fact that my feet and shpes were like sponges the entire run.
What May Have Worked
Heat Management – I put this as “may have” worked as I still got super hot and basically melted down at the end. I was very good at each aid station of (i) 2-4 cups of water on my head, (ii) cup of ice down the front of my suit (at my heart rate strap right above my heart) and cup of ice down the back of my suit and (iii) multiple sponges on head and neck. I even walked stations towards back half of the run (Miles 6-13.1) to ensure I did this.
What Didn’t Work
Overall Pacing – My race plan was ambitious to try and negative split the entire run and end up in the sub-7:00m/m zone by Mile 8. I was on track on Miles 1-5 (although Mile 2 was too fast for my plan). Ultimately, as the run continued and I got hotter and hotter, I just couldn’t hold the pace I wanted to. As I mentioned, I started walking the aid stations to cool off, and on a couple of the steeper hills on the golf course I also walked those rather than trying to run them. So that knocks the pacing down quickly. I forgot to set the auto-lap function on my Garmin, but here was my average pacing looking at the chart in TrainingPeaks (with post-race thought analysis added):
o M1 – 7:20 (Good – intentionally slowing down)
o M2 – 7:06 (Whoa buddy – take it easy)
o M3 – 7:17 (Back on track per plan)
o M4 – 7:18 (“Looking gooooooood Louis…“)
o M5 – 7:18 (“Feeling goooooooood Todd…“)
o M6 – 7:26 (Wait, I am supposed to be going 7:00/mile now!)
o M7 – 7:38 (I feel hot…)
o M8 – 8:03 (Walked some hills, start walking aid stations)
o M9 – 7:55 (Well, at least it says a 7 at the front of my watch)
o M10 – 7:49 (Yeah dude, turning it around)
o M11 – 8:05 (Thank god Yohann is here – I am cooking and want to make sure I am not speaking gibberish now)
o M12 – 8:07 (We are now on the surface of the sun. Also just ran by a guy having an intense seizure – make sure med is coming. OK, keep running but that definitely sucked the life out of me a bit)
o M13.1 – 7:25 (At least I dug deep at the end)
What Really, Really, Really Worked Well
Immediate Post-Race Cooling Montage – Immediately after the run, after the initial shock I walked over to the coolers and dunked my head in a bucket of ice for 20 seconds = instant cooling relief. I then chugged 2 Gatorades and walked over to Sarah to lament that I didn’t go sub-5:00, but didn’t think it was possible that day. After sitting for 10 minutes, I immediately went for ice cold Kona Lager….
Me and my Number One Fan Sarah after the race.

All in, we had a huge squad of 13 TriForce Triathlon Team racers at Honu. There were many strong performances detailed HERE, but in particular the team had 4 overall podiums with (i) John “Snickers” Nickerson – 1st M30-34 (4:43), (ii) Mimi “Usually” Winsberg – 1st W50-54 (5:17), (iii) Kevin “Coach” Coady – 2nd M40-49 (4:38) and (iv) Li Moore – 3rd M35-39 (4:44). Photos: Sarah & Carolina Bontia, respectively


And a special shout-out to some of the TriForce spectators that that braved the heat and sun to cheer us all on!

After a great dinner at The Canoe House (highly recommended), Sarah and I headed down further South by Kona for the remainder of the week on the Big Island. We explored Kona, went to Greenwell Farms and headed back to Hapuna Beach State Park a couple of times. Some various shots from the trip. Photos: Nick
Mauna Lani beach. Click for the full-sized version.


Our condo in Kona had awesome views!

Big Southern Swell during the remainder of our visit!


I got some great open water swimming in later in the week from the Kona Pier!


The sunset every night from our condo was incredible!

It was great to be drinking excellent Kona coffee every day – we stocked up for our trip home!

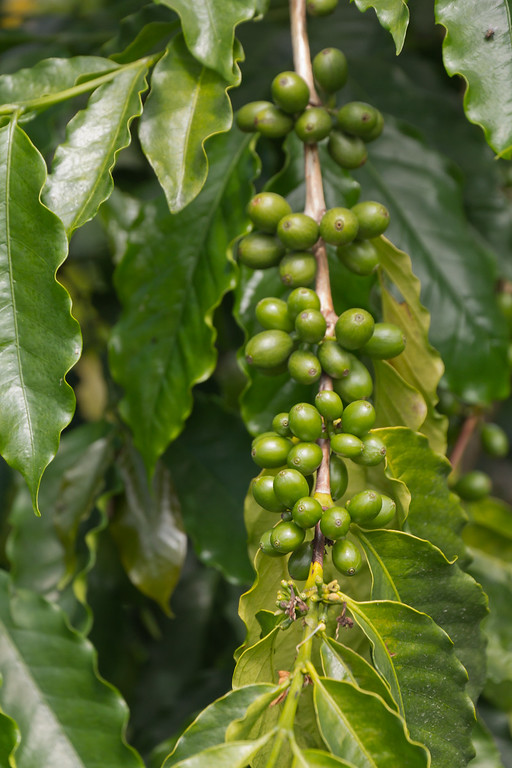

Amazing scenery and vegetation everywhere in Hawaii!

This was a great race and we can’t wait to get back again! As always, it is a trip best spent with someone you love. I have the best traveling companion in the World – my wonderful wife Sarah!


Great read! heading to Hawaii June 1 for the race this year interested in your bike file link doesn’t seem to work. Trying to come up with a race plan for the bike and our numbers seem very similar. any help would be appreciated thanks.